A significant and well-recognized difference between lasers and conventional, incoherent light sources, is the ability to concentrate laser emission in short pulses, with durations going down to a few femtoseconds, containing potentially only a few optical cycles. Technically, you can drive an incoherent LED source using current pulses, allowing the emission of light pulses down in the nanosecond range. However, each pulse would have a maximum power (i.e. a peak power) equal to the average power of the same device if a continuous bias were applied. Only laser cavities can concentrate the stored energy within active materials in such a way to achieve peak powers orders of magnitude higher than their average power, up to the exceptional PW-level recently reported in research publications.
Understanding Peak Power Calculations
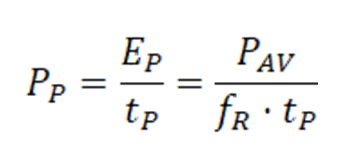
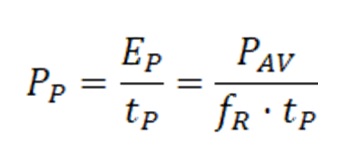
The extremely high peak power levels achievable by pulsed laser sources are among the main reason for their success in many of the applications which have emerged in the last decades. Therefore, a precise estimation of the laser peak power, given other operational parameters such as average power, pulse duration, and repetition rate, is fundamental to select the best option for a particular application among the different commercial alternatives. In principle, it is quite simple to calculate the peak power, considering the actual temporal profile of the laser pulse. By assuming a train of continuously repeated, periodical, square pulses with repetition rate fR, pulse duration tP and average power PAV, the pulse energy EP and peak power PP calculations are trivial, with pulse energy provided by the ratio between average power and repetition rate and peak power provided by the ratio between energy and pulse duration:

Of course, this simple relationship holds for laser pulses with a square or flat-top temporal profile, which is rather uncommon in practice. Usually, laser pulse temporal profiles are approximated more accurately with bell-shape functions, such as Gaussian profile or Sech2 profile, the latter being relevant mainly for ultrashort pulses obtained by the passive mode-locking regime. In this case, one should redefine pulse duration as being full-width half-maximum (FWHM), a commonly accepted parameter. Since the energy concentration in a Gaussian pulse, with FWHM duration tP, is slightly different from a square pulse with equal pulse duration, one needs to adjust the formula above:

Understanding Peak Power – Gaussian Pulse Shape
Necessarily, the smoother leading and trailing edges of a Gaussian pulse slightly reduce (by a factor of 0.94) the peak power for given pulse energy or average power. The point is that the situation might be further complicated when lasers emitting few-nanosecond-long or sub-nanosecond (e.g., picosecond) pulses come into the picture. Usually, a Gaussian pulse shape is an excellent approximation for the real pulse profile of Q-switched DPSS lasers, even though it is accurate only for lasers operating in single longitudinal mode (SLM). Most commercially available Q-switched lasers rely on multiple longitudinal modes, oscillating at the same time with constant interference. This effect is visible by acquiring optical pulses with sufficiently fast photodiodes and digital oscilloscopes, showing an amplitude modulation superimposed to the Gaussian pulse shape. The period and depth of the modulation depend on the number of longitudinal modes oscillating together. For tens-of-nanoseconds-long pulses, resonators support so many modes that the modulation is averaged out and hardly visible. Still, for sub-nanosecond operation, only a few modes are left, giving rise to deep modulation on the pulse envelope and strong deviation from the ideal Gaussian shape. A full-width half-maximum pulse duration definition becomes questionable, and a more refined statistical definition should be employed, giving rise to a correction factor for the peak power higher than 1 (potentially a factor of 1.5 could be a reasonable guess).

Figure 1: comparison between different energy-normalized pulse shapes. |

Figure 2: Average power and pulse duration as a function of the repetition rate for Bright Solutions’ WedgeHF laser. |
By considering for example the performance curves of a standard Bright Solutions’s Wedge HF laser at 1064 nm, the average power at 100 kHz is 4.6 W and pulse duration is about 2.5 ns, giving a peak power of ~ 18 kW.

Peak Power vs Average Power – Examples
At lower repetition rates, the pulse duration of Wedge HF laser is shorter, while pulse energy is higher, giving an higher peak power. Therefore, for instance, at 10 kHz, with pulses of ~ 700 ps and average power of ~ 1.8 W, the peak power rises up to ~ 260 kW. For a more detailed comparison between different industrial-grade laser sources at 1 μm, the table hereunder summarizes peak power and other critical parameters.

In the table above, it is clear the advantage in terms of understanding peak power achievable by shorter pulse durations, even with much lower average power levels. The laser models indicated in the table have similar beam quality (M2 < 1.5 for all of them). Therefore, they could be focused on similar spot sizes and the application relevant peak power densities change proportionally to the reported peak powers.
Let RPMC Help Find the Right Solution for You!
Let one of our knowledgeable Product Managers answer any questions or provide assistance choosing the right laser by emailing us at info@rpmclasers.com or by clicking the button below!
Have questions?

 SHIPS TODAY